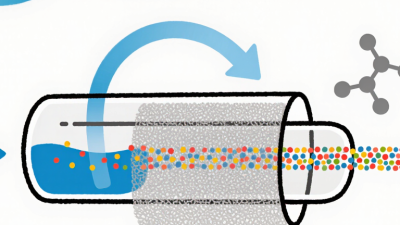

7 Tips for Choosing a Tangential Flow Filtration System
Selecting a tangential flow filtration system is not a simple equipment purchase. It is a process decision.
During pilot work, I have seen small details create large consequences. A narrow tubing path increased hold-up volume. A poorly matched membrane reduced recovery. One operator also chased higher flux and overlooked rising transmembrane pressure.
Downstream-processing expert Peter Gagnon offers a useful principle: “The process should fit the molecule, not the other way around.” That idea should guide every selection decision. Protein size, viscosity, concentration, shear sensitivity, and formulation goals all matter. So does the final batch scale.
This guide presents seven practical tips for choosing a tangential flow filtration system. It examines membrane chemistry, effective filtration area, channel design, pump control, sensor placement, cleaning requirements, and future expansion. These factors affect more than throughput. They influence product yield, process consistency, operator workload, and validation confidence.
Look closely at the numbers.
A system rated for high flow may still perform poorly with a viscous feed. A compact skid may save space but limit flexibility later. Disposable flow paths can reduce cleaning work, yet they may increase recurring costs. These trade-offs deserve careful review.
No checklist is perfect. Real process data can challenge early assumptions. Small-scale trials remain essential before purchasing a production unit. Ask vendors for flux curves, pressure limits, material compatibility, and scale-up evidence.
The right system should protect the product and support reliable operation. It should also leave room for honest improvement.
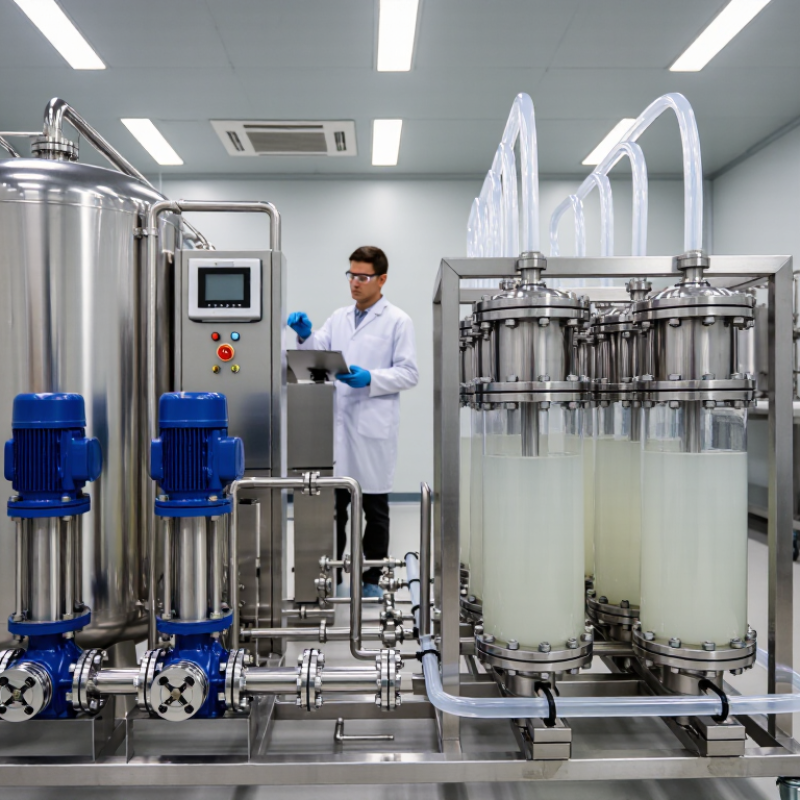
Define Feed and Product Targets: Choose MWCO at 3–10× Below Product Size
Choosing a tangential flow filtration system starts with measurable feed and product targets. Record molecular weight, concentration, viscosity, temperature, and expected recovery. The membrane molecular weight cut-off should usually sit 3–10 times below the product’s molecular size. This creates a practical retention margin, not a guaranteed barrier. MWCO values are nominal and depend on shape, charge, pressure, and membrane chemistry.
Tip: Test before scaling. Run a small flat-sheet or hollow-fiber study using the actual feed. Measure product passage, flux decline, concentration polarization, and recovery. A 100 kDa protein may not behave like a simple 100 kDa sphere. That assumption can become expensive.
FDA process-validation guidance stresses linking critical process parameters with measurable quality attributes. ISPE’s bioprocessing reports also identify yield, scalability, and process consistency as persistent manufacturing concerns. These findings support a data-led MWCO decision rather than relying on catalog ranges. In practice, screening two or three MWCO options can reveal a useful trade-off: tighter membranes may improve retention but reduce flux, while larger pores can shorten processing time and increase product loss. One overlooked detail is feed conditioning. Aggregates, high solids, or air bubbles can distort early results. I would not accept a single successful run as proof. Repeatability matters, and sometimes the “best” membrane on paper performs poorly after several hours.
Select Membrane Chemistry and Area: Size Systems at 20–100 LMH Flux
Choosing a tangential flow filtration system starts with the membrane, not the pump. Membrane chemistry affects recovery, fouling, extractables, and cleaning tolerance. Regenerated cellulose may suit sensitive biological materials, while polyethersulfone can offer useful mechanical strength. Compatibility must be checked with the process fluid.
I size membrane area by estimating the required flux, usually between 20 and 100 LMH. LMH means liters per square meter per hour. For example, processing 40 liters per hour at 50 LMH requires about 0.8 square meters of membrane area. I then add practical capacity for viscosity changes and gradual fouling. A clean calculation can still mislead. Actual flux may fall sharply after concentration begins.
Watch the pressure profile during trials. A small system with transparent tubing can reveal air pockets, uneven flow, or rising transmembrane pressure. These details often explain poor performance better than a spreadsheet. Start near 20–40 LMH for fragile or viscous feeds, then increase carefully when product recovery remains stable. Higher flux can shorten processing time, but it may also accelerate fouling and increase product stress. Test membrane binding with a small representative batch, including the intended buffer and temperature. Do not rely only on supplier specifications. Your process conditions are less forgiving.
7 Tips for Choosing a Tangential Flow Filtration System - Select Membrane Chemistry and Area: Size Systems at 20–100 LMH Flux
| Tip | Selection Dimension | Practical Guidance | Typical Membrane Chemistry | Useful Starting Flux | Sizing Example | Key Check Before Scale-Up |
|---|---|---|---|---|---|---|
| 1 | Define the separation objective | Use microfiltration for clarification or particle removal, ultrafiltration for macromolecule concentration and diafiltration, and nanofiltration only when the required molecular-weight cut-off and solvent compatibility are demonstrated. | PES and PVDF are common for aqueous processing; regenerated cellulose is often considered when low nonspecific binding is important; ceramic membranes can be useful for harsh cleaning or solvent-tolerant applications. | 20–50 LMH for concentration-sensitive ultrafiltration; 50–100 LMH may be suitable for less fouling-prone clarification after testing. | For 100 L/h permeate at 50 LMH: Area = 100 ÷ 50 = 2.0 m² |
Confirm retention, recovery, product quality, and permeate clarity using the actual process fluid. |
| 2 | Match membrane chemistry to the product | Consider hydrophobicity, electrostatic interactions, adsorption, extractables, cleaning exposure, and compatibility with buffers, salts, surfactants, and process additives. | PES: broad aqueous compatibility and common use in protein processing. Regenerated cellulose: often selected for low binding characteristics. PVDF: mechanically robust, but hydrophobic grades may require appropriate wetting. Ceramic: strong chemical and thermal resistance. |
Begin conservatively at 20–40 LMH when adsorption or fouling risk is uncertain. | If the required permeate flow is 60 L/h at 30 LMH: Area = 60 ÷ 30 = 2.0 m² |
Run material-compatibility, hold-up, recovery, and protein-binding studies with representative concentration and buffer conditions. |
| 3 | Choose the appropriate molecular-weight cut-off | Select a membrane that retains the target while allowing contaminants, salts, or solvent to pass as required. A nominal cut-off is a starting point, not a guaranteed product-retention value. | Use a validated polymeric or ceramic membrane with a defined pore structure and documented retention behavior for the target molecule. | 20–60 LMH is a practical initial range for many macromolecule UF studies; the final value depends on concentration polarization and viscosity. | For 40 L/h at 40 LMH: Area = 40 ÷ 40 = 1.0 m² |
Measure target retention, impurity passage, sieving coefficients, and performance at the highest intended concentration. |
| 4 | Estimate membrane area from flux | Use the design equation Membrane Area (m²) = Required Permeate Flow (L/h) ÷ Flux (LMH). Include operating margin and account for flux decline during the batch. | Membrane chemistry, pore size, channel design, feed viscosity, temperature, and fouling all influence the achievable flux. | Use 20–100 LMH as a development envelope rather than a universal specification. Lower flux is usually more conservative for fouling-sensitive products. |
100 L/h requirement: 20 LMH = 5.0 m² 50 LMH = 2.0 m² 100 LMH = 1.0 m² |
Apply a design margin, commonly 15–30% for scale-up planning, after confirming the expected steady-state flux experimentally. |
| 5 | Control transmembrane pressure and crossflow | Higher pressure does not always increase useful flux. Excessive transmembrane pressure can intensify concentration polarization, gel-layer formation, and irreversible fouling. | Select a membrane and flow path that tolerate the required pressure, shear exposure, temperature, and cleaning conditions. | Start near the lower-middle portion of the 20–100 LMH range and increase only when product quality and flux stability remain acceptable. | At 80 L/h and 40 LMH, theoretical area is 2.0 m²; with a 20% margin, specify approximately 2.4 m². | Record feed pressure, retentate pressure, permeate pressure, crossflow rate, temperature, and flux over time. |
| 6 | Plan for concentration and diafiltration volume | Size the system for the most demanding stage, which may be the final concentration step rather than the initial batch volume. Diafiltration requires sufficient permeate capacity and controlled buffer addition. | Choose low-binding and cleanable chemistry when repeated concentration, buffer exchange, or high product recovery is required. | 20–50 LMH is commonly used as a cautious development range for viscous or highly concentrated retentates. | For a 500 L batch requiring 6 diavolumes, total permeate volume is approximately 3,000 L. At 100 L/h, this stage requires about 30 hours, before process interruptions. | Check final concentration factor, diafiltration efficiency, product residence time, temperature control, and acceptable batch duration. |
| 7 | Verify cleaning, integrity, and scale-up behavior | Select a system that supports reproducible cleaning, sanitization, integrity testing where applicable, and documented membrane-life assessment. | Ceramic membranes generally offer high chemical and thermal resistance; polymeric membranes require cleaning agents, temperature, pH, and exposure times within their validated limits. | Use the lowest flux that meets throughput and quality requirements when maximizing recovery and membrane life is important. | If a pilot test delivers 45 LMH but the process design assumes 60 LMH, recalculate area: for 120 L/h, 120 ÷ 45 = 2.67 m², not 2.0 m². | Confirm post-cleaning permeability recovery, product recovery, membrane integrity, repeatability across batches, and scale-up using comparable hydrodynamics. |
Set Process Conditions: Control TMP Around 0.5–2.0 bar
7 Tips for Choosing a Tangential Flow Filtration System
Set Process Conditions: Control TMP Around 0.5–2.0 bar
Transmembrane pressure, or TMP, directly affects flux, retention, and membrane fouling. For many protein concentration and diafiltration steps, a practical starting window is 0.5–2.0 bar. Begin near the lower end, then increase pressure gradually while tracking permeate flow, conductivity, and product recovery. Higher TMP is not always better. It can compress the fouling layer and reduce effective throughput. BioPlan’s 2024 Annual Report surveyed more than 200 biopharmaceutical organizations and highlighted process consistency as a major manufacturing priority. Stable TMP supports that goal.
Tip: Build a pressure map.
Record inlet pressure, outlet pressure, and permeate pressure at regular intervals. A system showing 1.2 bar TMP may still behave poorly if the feed channel pressure changes sharply. Keep the feed flow high enough to create useful crossflow, but avoid excessive shear. Protein solutions can be sensitive, especially after long recirculation.
Tip: Confirm the real operating window.
Pilot trials should test at least three TMP settings, such as 0.5, 1.0, and 2.0 bar. Compare flux decline, concentration time, yield, and filter recovery. The “best” setting may shift with viscosity and membrane loading. That is easy to overlook. It should not be. FDA process-validation guidance also supports using measured process data to define and control critical operating ranges.
Assess Recovery and Scale-Up: Target ≥90% Product Recovery
Recovery should be a go/no-go metric when selecting a tangential flow filtration system. Set a target of at least 90% product recovery after concentration and diafiltration. Measure it by mass balance, not by appearance alone. A clear retentate can still hide product losses.
The 2024 BioPlan Associates Annual Report and Survey of Biopharmaceutical Manufacturing highlights yield, process consistency, and manufacturing efficiency as continuing industry priorities. These findings support a practical test plan. Record feed volume, retentate volume, concentration, conductivity, and product assay at every step. Calculate recovery using total product mass before and after filtration. A 2% sampling error can change the decision.
Do not trust one successful run. It is too fragile. Test at small, intermediate, and projected production scales. Maintain comparable membrane flux, transmembrane pressure, shear exposure, and processing time. PDA Technical Report No. 66 emphasizes risk-based process understanding and control during filtration development. That matters during scale-up, where hold-up volume and tubing length can increase unseen losses. I would also challenge the system with a low-volume run, because dead volume often becomes more significant near the end of a batch. A 92% result may look excellent, yet inconsistent recovery across three runs deserves investigation before equipment approval.
Verify Compliance and Cost: Require 21 CFR Part 11 Data Integrity
A tangential flow filtration system should protect product quality and electronic records. Compliance is not a checkbox added after installation. It must shape the system specification from day one.
Require demonstrable alignment with 21 CFR Part 11. The system should support controlled access, unique user accounts, audit trails, secure timestamps, and validated electronic signatures. Ask for raw data export, backup procedures, and readable audit-trail reviews. Test these functions using real process events, such as a changed pressure limit or deleted sample entry. Small gaps become expensive later.
The FDA’s Data Integrity guidance emphasizes that regulated records must remain reliable and accurate throughout their lifecycle. IBM’s 2024 Cost of a Data Breach Report places the average healthcare breach cost at 9.77 million dollars. A filtration system cannot prevent every incident, but weak access controls can increase exposure. Request validation evidence, change-control records, and documented support responsibilities before purchase. Also compare licensing, training, validation, maintenance, and data-retention costs. The cheapest quotation may hide recurring compliance work. That deserves scrutiny. One practical concern is often missed: operators may bypass inconvenient workflows during production. Observe a simulated run, not only a sales demonstration.
Related Posts
-
What Is a Cross Flow Filtration System?
-
How to Optimize Cross Flow Filtration for Maximum Efficiency in Industrial Applications
-
7 Compelling Reasons to Choose the Best Side Stream Filtration for Your Heating System
-
How Filter Technology Reduces Waterborne Contaminants by 99.9% in Industrial Applications
-
Exploring Alternatives to Best Microfiltration Membrane Technology for Enhanced Water Purification
-

Top 10 Innovations Transforming the Pulp and Paper Industry for a Sustainable Future